
Return to FAQ Page
General Questions on Enviro Data
Answers to common questions about using Enviro Data.
Questions
There are two possible causes for forms to fill the whole page or look weird. Both are generally easy to fix.
The first case is that the form takes up all of the Access window and is a result of a common error. Itis caused by Maximizing the current window using the control found in the upper right of every Windows window (see figure immediately below). This is most commonly seen when using Print Preview to view an Access Report and then zooming in to enlarge it and then forgetting to Restore [it] Down (shwon in second image below). it. This can happen with any Access form so make sure you Restore after Maximizing!


The second case is a little more complicated, but is still easy to fix. Your forms, tables, etc. will show up as Tabs in the Access window. This make the many form look strange and hard to see their data. An example of tabbed Access windows are shown below.

To correct this, on the Access menu in the upper left (shown above) click on File and then on Options at the bottom left. In the Access Options form that opens (shown below), click on Current Database and change the setting for the Document Window Options from Tabbed Documents to Overlapping Windows. Click OK to return to Access.
Note you must Exit all Access programs and restart them to apply this change. You can restart by simply opening Enviro Data.

To use as an example to answer this question, a client asked: We report multiple different units and filtered analysis…e.g. the analysis is Chlorophyll, the filter is lab 0.22, the units are mg/L and then for the same station I also have a field 0.45 and units are mg/L for reporting OrthoP for the same station. How is that handled in Enviro Data.
In this scenario, a sample taken at a site and filtered in the field with a 0.45u filter, all these analyses would have the FilteredSampleCode of F45U. When the lab reports Chlorophyll back they would use a FilteredAnalysisCode of L22U (for Lab 0.22u). The OrthoP result would have its own FilteredAnalysisCode of TOT. The units for both would be whatever the lab reports. (See Filtered table below.) However, if the OrthoP sample was not filtered, it would be a different sample even though it was filtered in the lab. They obviously would not be the same Analysis since the Parameter is different.
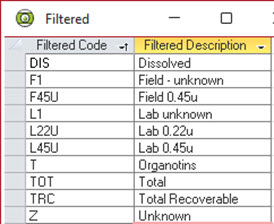
Filtered lookup table.
Also, if these two samples did not all have the same criteria as shown in the unique index for the Samples, they would not be the same sample.
Criteria for a Unique Sample
Enviro Data identifies unique samples based on the station, sample date, sample matrix, sample top, duplicate sample, sample bottom, filtered sample, field sample ID, QC sample code and alternate sample ID fields as seen below. This allows the data administrator to import multiple samples related to one sampling event or make multiple imports of analyses from a given sampling event.
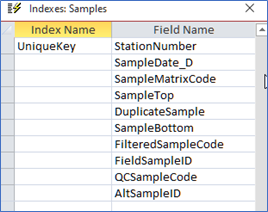
Fields used to define the Unique Index in the Samples Table.
Criteria for a Unique Analyses
Enviro Data identifies unique analyses based on sample number, parameter number, superseded, analytic method, leach method, report units, basis, filtered analyses code, QC analysis code and lab sample id fields as seen below. This allows the data administrator to import multiple analyses related to one sample or make multiple imports of analyses from a given sampling event. Re-analyses or analyses delivered at separate times are matched to the correct sample event by the import code using the unique fields listed above.
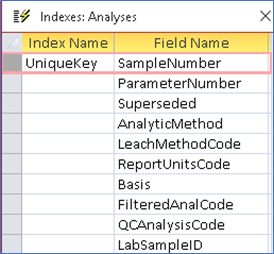
Fields used to define the Unique Index in the Analyses table.
There are several symbols used in the MS Access system (that Enviro Data is written in) that should not be used in your data fields. The use of these may cause errors because Access may treat them as actions or code to be acted on and can also cause problems with file names and paths. These symbols include:
. (period) This is OK when used as a decimal point but might cause problems elsewhere.
, (comma) This is generally not a problem but it depends on where it is. It can cause a problem in Site Name.
/ (forward slash)
\ (back slash)
* (asterisk)
; (Semicolon)
: (colon)
! (exclamation point)
# (number, pound or hash tag)
& (ampersand)
- (dash) When used in numbers might result in subtraction. This is OK when used in site or stations names and other text.
? (question mark)
" (double quote or inches symbol)
' (single quote or foot symbol)
$ (dollar sign)
% (percent) This is acceptable for a reporting unit but within other data fields it is best spelled out.
Many times, a problem with Enviro Data can be traced to a problem with the computer itself. Below are some of the solutions to try when something does not seem right with your computer. While these may not solve your problem, they will not harm your computer. They only take a few minutes to run and rely on tools built into Office and Windows. We recommend you run them in the order shown. While these steps apply to all versions of Windows, the terminology may vary slightly from one version to another.
Note that we are assuming you are running an up-to-date antivirus and/or antimalware application.
If you are having a specific problem with Enviro Data, try these steps first.
- Restarting usually solves most issues. Before restarting, make sure you have saved any settings or files you need. Note we are not talking about turning your computer's power off.
- Click on Maintain Database and then click Clear Temporary Tables.
- Close Enviro Data and then and open the database file you were attached to in Access then run "Compact and Repair*. This should only take a few minutes. Note that this step does not apply to databases on SQL Server.
- Open both the EDITOR and VIEWER programs and run Compact and Repair in each from Access’ Database Tools menu.
- Check to see if you are still having the problem. If so, continue below.
- Check your hard drive to see how much free space you have available. It is recommended to have at least 10% free space. You can check this by opening the Windows Explorer in My Computer view (this will vary depending on the Windows version) and check to see how much space you have free on your hard drive(s). If you see a red bar, you need to move or delete some files to free up space. (If you cannot delete or move any files you may need to get a larger drive.) To help free up space run the Windows Disk Cleanup (CTRL-R and type in disk cleanup).
- While still in Windows Explorer, right click on the C:\ drive and choose Properties then use the following steps. Click on the Tools tab. Click on Error checking and then click the Check button. You may see a warning; "You don’t need to scan this drive.” Do it anyway. This may only take a few minutes unless there are serious errors on your drive. (Repeat this for other drives as appropriate.)
We typically do not recommend reinstalling Enviro Data unless directed to by our Support staff.
If you are still having problems with Enviro Data after going through the above steps, send our
It may be necessary for Geotech Support to have a sample, or subset, of your database in order to determine the issues you are encountering. A subset is a portion of your database in an Access (MDB) format from the Select Data query you used that replicates the issue.
Creating a subset of your database is very easy. Use the Select Data form with the data set used when you encountered the problem, click on Export and choose Enviro Data Access file (subset) and save the resulting database. Note that it must be compressed (zipped up) prior to sending to Geotech.
Also, when saving the subset database there cannot be any spaces in the file name or path to the folder where it is stored.
1. In Enviro Data (either the Editor or Viewer), at the top left-hand corner click on File in the Access file menu.
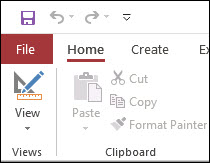
2. At the very bottom, click on Options to open the Access Options form.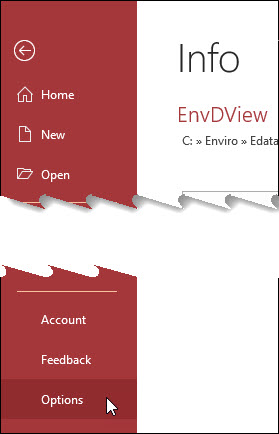
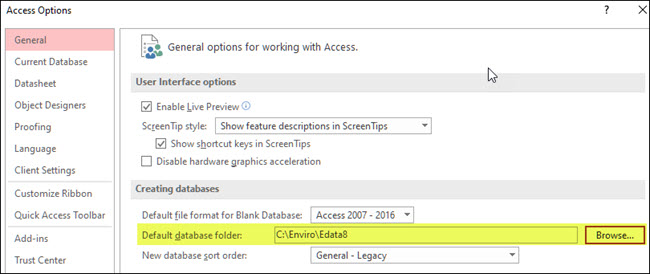
3. Make sure General is selected in the top left of the Access Options form. (See below)
4. Under Creating databases section, the Default database folder, click the browse and choose the folder you wish Enviro Data to open in.
5. Click OK to return to Enviro Data. You may have to restart Access for this to take effect.
In most you should select the folder C:\Enviro\EData8 because you will need to access multiple folders in this one. However, you could also set it to C:\Enviro\EData8\Databases for attaching a database or C:\Enviro\EData8\Import or C:\Enviro\EData8\Export depending on your needs.
The Lab Master Service Agreement Tool or Lab MSA system helps project staff track laboratory invoices. The user sets up one or more master service agreements. The lab costs are entered by method, plus add-ons. When an electronic data deliverable file (EDD) is imported through the Import Wizard, the user can have the software create a record for the sample delivery group (SDG) and enter data in as many of the fields as possible. Each SDG also represents a laboratory invoice. From this, the invoice cost items can be calculated. Forms are provided for editing the SDG data during the import. The system calculates the costs for the samples and methods, and the user can add any lab add-ons. Two reports are provided, one for the MSA/invoice detail, with a similar appearance to a lab invoice, and another showing a list of invoices selected by date and site, along with their status.
To learn more please see the video instruction for the Enviro Data Lab Master Services Agreement Tool on our YouTube channel.
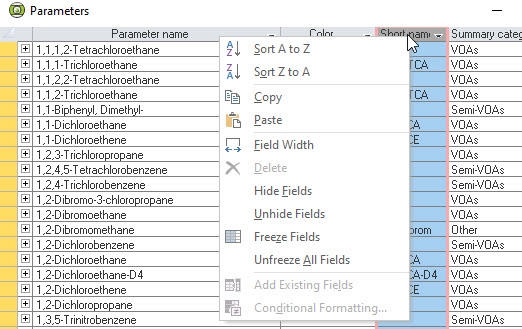
There are many ways to view or list data in Enviro Data. The Select Data form in the Viewer provides a Quick List, List, Report, Export and Graph buttons that produce a variety of output. In the Editor, you can list Sites, Stations, Samples and Analyses using these buttons and the Datasheet button. Additionally, the Manage Lookups form in the Editor provides a way to edit and view many of the lookup or valid values tables again using the Datasheet button on each of the forms.
Most of these lists, regardless of where they are found, can be modified by either right-clicking in any field header and changing the options or, by selecting one or more columns and dragging to change their order in the header. The screen shot below from Manage Lookups --> Parameters --> Datasheet shows the options available in lists.
There are multiple ways to store geologic data in Enviro Data.
You can assign geology and lithology to each physical sample in the Samples table and store these lookup values in their respective tables. This makes it easy to tie the geology to field and lab data.

You can also select a geologic unit for each station in the Stations table. This is generally used for the formation at the bottom of the hole for soil and similar borings, or the geologic unit of the screened interval for water wells.
Finally, in the Stations table you can store formation “tops” by location and independent from the samples. This probably better represents the actual site geology and allows you to enter the geologic column encountered at a Station location by depths. This could be (and often is) different from the geology of the samples and may be referred to as the site stratigraphy. You can do this in the form below from the EDITOR; click on Stations and then on the Geology tab as shown below.

The Map tool used a 32-bit add-on to create the mapping feature. It is still available iin current versions of Enviro Data but only when installed with 32-bit Office. Geotech is looking for a substitute that will supports both 32 and 64-bit Office.
The Map feature allows you to display simple dot maps in Enviro Data without needing a separate mapping program. You will need a vector base map (such as a CAD drawing or a ShapeFile) and optionally a bitmap image. These should be entered on the Sites form for each site for which you want to make a map. You will also need coordinates in the Stations table that match those of the base map. Then select data for one parameter, click on Map at the bottom, answer the questions on the next two forms, and your map will be displayed. Additionally, to use a shapefile as the base map, export the shapefile to AutoCAD Release 14 format and use the resulting CAD file as the base map.