
Return to FAQ Page
General Questions on Enviro Data
Answers to common questions about using Enviro Data.
Questions
When you get a notice that no records were return when selecting data this usually means that the selection criteria you have entered on the SELECT DATA form did not result in any data being retrieved this generally mean you need to change your selections.
If you wan t to double check, on this form click on the Update button and see if anything changes. You may also see a popup reading "Sorry but . . . No records were returned from the criteria you specified." "If not, try changing the selection criteria.

Parameter Units are used by Enviro Data for comparison to regulatory limits and for the unit conversion feature. (Unit conversion allows you to determine the target units for a conversion during import or reporting so all units are the same for the specific parameter.) You can associate one reporting unit or Parameter Unit for each combination of a parameter and matrix.
For use with Regulatory Limits, the Parameter Units and the matrix must match the units and matrix of the limits you are checking against.
They are also used during import checking, the Validation module, and in some reports.
You can view and edit Parameter Units by going to the EDITOR's Setup section, clicking on Manage Lookups and then clicking on Parameters. This will open the PARAMETERS form seen below. You can select the parameter desired in the Go to Parameter dropdown. Both the Matrix and Parameter Units can be set by using dropdowns in the appropriate text box. Note that both the Matrix and Units chosen must be present in their appropriate lookup table.
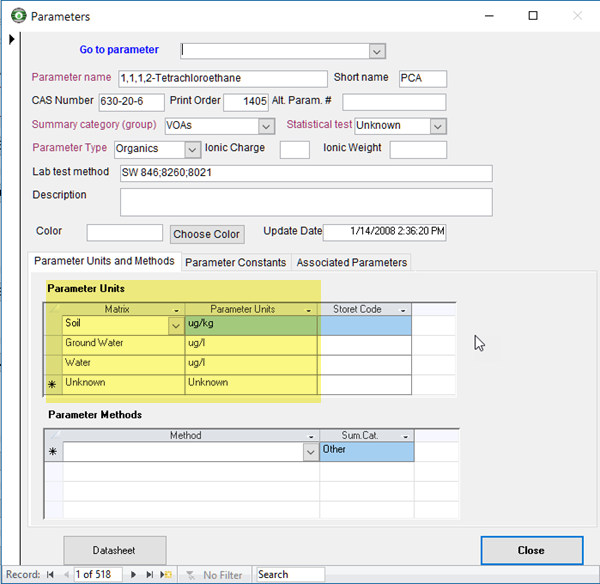
If you have started a new database and wiped out all the data in the Parameters along with its related table and have a large number of ParameterUnits to populate, Geotech Support may be able to provide a query to populate the ParameterUnits for you but you will need to provide a spreadsheet with the parameter names, matrices and units in order to run this query.
In order to have these work with your data, make sure you also set Unit Conversion in the Display Options form as shown below.

There are over eighty lookup tables in Enviro Data that contain lists of "lookups" or valid values. Lookups, common to a relational database, can be used for parameter names, flags, units, etc. As such, they help interpret the data in the primary tables and enforce data quality. Because they often change from project to project, they can be managed separately in each project database if needed. This makes it easy to customize a database for your specific project needs Enviro Data gives you complete control of these lookup tables and you can customize them to suit the needs of each of your projects. Note that the lookups that come with Enviro Data should be considered suggestions.
Lookups can be edited using Manage Lookups form in the EDITOR shown below.

Analytic Flag Codes
The FlagCode field (aka Data Qualifier) is available in electronic data deliverables or EDDs provided by your lab and is loaded into the Analyses table. When a qualifier is not needed, the FlagCode field in the EDD should be left null (blank). When needed, it can contain up of four individual FlagCodes each with up to four characters. When multiple Flag Codes are used in this field, they must be separated by either a space or comma, such as “J1 J2”. This not only applies to FlagCode, but also to ProblemCode, and ValidationCode. However, if one is needed, it must have a matching entry in the appropriate lookup table: AnalyticFlags, ProblemCode, or ValidationCode.
It is important to understand that in Enviro Data there are two similar but different FlagCode fields, one in the AnalyticFlags lookup table and a different but similar on in the Analyses data table. The FlagCode field in the Analyses table contains one or more FlagCodes from the AnalyticFlags table and they are separated by either a comma or a space.
AnalyticFlags Lookup Table
The flag code in AnalyticFlags is a lookup that stores a single code and cannot contain any spaces or commas. The AnalyticFlags table stores the following:
- FlagCode is the code for ONE Analytic Flag. It can contain multiple characters but cannot contain a space or comma.
- AnalyticFlag is a description of the code.
- ReportingFactor is used as a multiplier for statistical analysis. Note that this can be impacted by selections in Non-Detect Options on the Display/Graphing Options
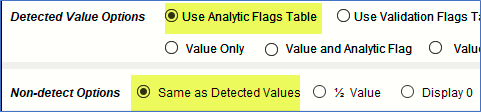
- ReportingBasis indicates how to display the output. See examples in Reporting Basis. NOTE: Use Analytic Flags Table must be selected in the Detected Value and Same as Detected Values on the Display/Graphing Options form as shown below for the Value and Flag field to be displayed in the ReportingBasis format in Reports or Exports.
There are multiple reasons why trailing zeros are lost and/or decimals places are not displayed correctly. Options for decimal places can be found in the EDD that is imported, the import setting and in Display Options when the data is reported or exported. (See screen shots below.)
1. Our standard EDD has a NumberDecimals field that the laboratory can populate when importing data. If this field is used, Enviro Data stores that information in that field in the Analyses table for use when the result is displayed.
2. If the NumberDecimals field in the EDD is not populated Enviro Data calculates the number of decimals from the Value field and stores that number. If this is the case, you can choose to use the decimal places from either the Value or the Detect field in the EDD.

Options for # of Decimals in the Import Wizard in the Editor
3. When preparing reports or exporting data, there is the Number of Decimals option in Display/Graphing Options that can determine how the decimal place to be displayed. The options are Exact Value or Auto. Setting this option to Auto will use the NumberOfDecimals value stored in the Analyses table to add back trailing zeros if necessary. Choosing Exact Value turns this feature off and uses the Value field as it is stored The Auto option is necessary because Microsoft Access (and Excel for that matter) do not normally store or display trailing zeros. Loss of these zeros can be a problem because they contain information about the precision with which the result was measured.
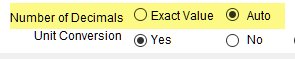
Options for Number of Decimals in the Display/Graphing Options form in the Viewer
4. Once you have the correct decimals places stored and output, the Viewer outputs the Value of an analysis with the correct decimal places based on the option chosen.
Your results will vary depending on the output chosen. For the Crosstab Export, Value and Flag is always stored as text and this is recommended. However, the Value (only) field is numeric. If you are depending on the Value field only, this can be problematic because Excel does not store or display trailing zeros in a numeric field.
Note that if you are having a problem with decimal places and/or significant figures, you should check with Support to see if there is a newer version available. Also, the screen shots shown above may vary slightly depending on your version of Enviro Data.
Trailing zeros are NOT supported in regulatory limits as they are meaningless.

This error generally occurs because the Parameter Units field has not been set for the parameter and matrix shown in the error message. However, it can also be displayed when you list / report Surrogate and regular analyses which have different matrices.
Enviro Data only displays this error message for the first Parameter Units error even if there are additional one that need attention. The parameters with errors are indexed in alphabetical order. In the case above with Arsenic, there would likely be more errors to correct. If this error was for Zinc, you might not expect any more. Additionally, since some routines in Enviro Data may loop through the data more than once to produce the output required so you could see the same message again before it finishes processing.
Pparameters Units are used by Enviro Data for comparison for both regulatory limits and the unit conversion feature. You can associate one reporting unit (or Parameter Units) for each combination of a parameter and matrix. Unit conversion converts any units to the matching select units set in the Parameter Units. For use with Regulatory Limits, the Parameter Units and the matrix must be the same as the units (and matrix) of the limits you are checking against.
Target units can be set in the Parameter lookup table and conversion can be set in Unit Conversion lookup table, both found on the MANAGE LOOKUPS form. You can find more information on this issue in the FAQ at What are parameter units and why do I need to set them?
For quality assurance and quality control (QA/QC) purposes, environmental projects generate duplicated data in a variety of ways. Care needs to be taken with this duplicated data at both the samples and analyses levels. Enviro Data can handle duplicated data at both the samples and analyses levels. To import this duplicated data, the system uses two fields, DuplicateSample and Superseded, which are numeric fields in the Samples and Analyses tables respectively.
Duplicate Samples.
Duplicate sample are one or more additional samples taken from the same station at the same time to check the quality of the sampling, shipping, and analysis processes. This information is stored in the DuplicateSample field in the Samples table.
At the sample level, this data could be QA/QC data associated with an original sample such as a field duplicate. As an example, an original sample assigned a DuplicateSample number of zero might have a field duplicate taken on the same day, which would be assigned a DuplicateSample number of 1. The QCSampleCode in the Samples table is used to explain the meaning of the two samples, with perhaps a code of “Original” for the first sample, and a code of “Duplicate” for the second. Additional related samples are given higher DuplicateSample numbers. In some cases, the additional sample might be a second original sample instead of a QC sample. In this case, the QCSampleCode might be the same for both samples, however, in most cases the LabSampleID number would be different.
Enviro Data identifies unique samples based on the station, sample date, sample matrix, sample top, duplicate sample, sample bottom, filtered sample, field sample ID, QC sample code and alternate sample ID fields as seen in the figure below. This allows the data administrator to import multiple samples related to one sampling event or make multiple imports of analyses from a given sampling event.
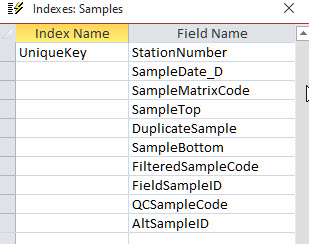
Figure 134 - Fields used to define the Unique Index in the Samples Table
Superseded Analyses
A superseded analysis is a duplicated result from one or more a re-analysis of the same sample for a single or group of parameters for QA/QC purposes. This results in duplicated or superseded results at the analyses level. In the industry these results can be represented in two ways, either as the original result plus the re-analysis, or as a superseded (replaced) original result plus the new unsuperseded result. This information is stored in the Superseded field in the Analyses table.
During import Enviro Data provides a way to supersede the original result value as this is more useful for selection purposes. You can choose to supersede or replace (overwrite) a superseded result by checking or unchecking the Supersede Values If Present checkbox in the IMPORT WIZARD – OPTIONS AFTER CHECKING After Successful Check section. If this box is checked, a new analysis will supersede the old one. Otherwise, if it is unchecked, the new analyses will replace (overwrite) the old one. Either way, in the when selecting data, you can easily choose to see just the most current (unsuperseded) data. Selecting the re-analyzed results is not as helpful because not all the parameters may have been re-analyzed.
Enviro Data identifies unique analyses based on sample number, parameter number, superseded, analytic method, leach method, report units, basis, filtered analyses code, QC analysis code and lab sample id fields as seen below in the figure below. This allows the data administrator to import multiple analyses related to one sample or make multiple imports of analyses from a given sampling event. Re-analyses or analyses delivered at separate times are matched to the correct sample event by the import code using the unique fields listed above.
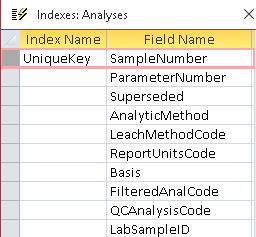
Figure 135 – Fields used to define the Unique Index in the Analyses table.
Discussion of Duplicates and Supersedes
Examples of data at these two levels, and the various fields that can be involved in the duplications at each level, are shown below.
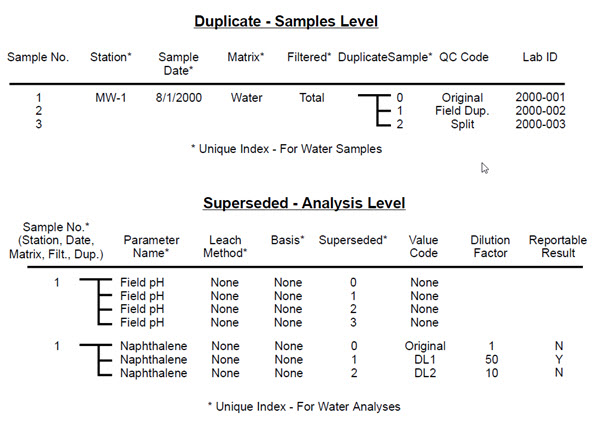
Figure 136 - Diagram of duplicates and supersedes
In the Sample Level example in the figure above, there are three samples from the same well on the same date: an original sample, a field dup, and a split. These are represented with three different DuplicateSample numbers, and three different LabSampleID numbers.
In the Analysis Level there are superseded results for two different reasons.
In the field four different pH values were taken, most likely to confirm that the well chemistry had stabilized prior to taking a sample. The results have increasing superseded values from 0 to 3, with the 0 value being the most recent and presumably most representative value.
For naphthalene, multiple results were reported possibly due to matrix interference. The dilution factor for each result is shown. The original sample is reported with a superseded of zero, and the dilutions with higher superseded values. The ReportableResult field has been used to override which result will be reported. An alternative would have been for the data administrator to adjust the superseded values so the value for the result at a 50:1 dilution had a superseded value of 0 and it would be displayed by selecting a superseded value of 0 on the SELECT DATA form.
At the analyses level, the Superseded field is incremented when different analyses apply to the same sample and parameter. For example, multiple dilution analyses can be stored with incremented superseded values of 0, 1, 2, etc. Likewise, a re-analysis can be stored with a superseded value of zero (most recent data), while the original value remains in the database with a superseded value of 1. Note that this use of superseded values is the opposite of the more traditional view of new data for the same parameter as being a “re-analysis.” Experience has shown that while both the superseded and re-analysis view of the data validly describe what happened, the superseded approach is more useful for selecting data, since you can select the “unsuperseded” data (Superseded = 0) to suppress all but the most representative data. This is the default on the SELECT DATA form in the VIEWER program, so for the most part people get what they expect without much effort.
While you can manually change or delete the values in the Duplicate or Superseded Field Criteria boxes in the Select Data form, this form now had a dropdown control that will toggle them between a value of 0 (zero) and nothing (Null). This control can be found near the left side the Action Buttons Bar. “Display 0” is the default setting and how Enviro Data has historically opened the Select Data form. Caution: This should only be used to show the specific duplicated and/or superseded information when outputting data for calculations, exports, and reports.

The default is to leave this control set to “Display 0”. This means that both the Duplicated or Superseded Fields Criteria boxes will contain a 0 and duplicated or superseded data will NOT be provided in the dataset. If this control is changed to “Nothing”, the default of 0 is removed from both the Duplicate and the Superseded Fields Criteria boxes. The resulting dataset WILL contain every duplicated sample and every superseded result.
The ValueCode field provides a reason for the superseded value, such as re-analyzed, dilution, etc. however, the ValueCode field is not used to order the superseded sequence. The software sets superseded values if one of the Duplicates and Supersededs options on the IMPORT WIZARD form, shown below, is selected as described in Duplicates and Supersedes section in the User Documentation.

Figure 137 - Duplicates & Superseded settings in IMPORT WIZARD form
Correctly assigning QCSampleCode is crucial to identifying original vs. QC data as the QCSampleCode field is used to correctly identify original data vs. QC data for reporting. If you are importing data with QC sample information, you must populate the DuplicateOrder field in the QCCodes lookup table before importing as the Import Wizard uses this field to set your duplicate values based on the duplicate order.
Understanding duplicate and superseded values is very important for understanding QC and other data in Enviro Data. Selecting data based on duplicated and superseded values is discussed in Select Data section of the documentation.
List applies the selections made the Display Options form to the data selected and then populates the Selected Data table with that formatted data. This formatting includes converting reporting units, providing Value and Flag and other features in the table. Depending on the amount of data selected, this can take time to prepare and display.
Quick List provides a basic listing of the selected data WITHOUT applying any formatting and shows the reporting units as they are stored in the Analyses table without making any unit conversions. Because Quick List does not perform any formatting or Limits, it is much faster than List and is valuable for viewing raw data.
Both can be used to create a Excel spreadsheet. When in List, click the Export To Excel button in the lower right. In Quick List, click in the upper right corner of the table to select all records and use Copy and Paste to put them into Excel. You can also copy a row or rows of records to Copy and Paste.
Before you request support please read ALL of the following,
Have you checked the Documentation for a solution to your problem? the documentation can be downloaded using the Download button in both the Editor and Viewer.
Have you checked the Frequently Asked Questions on our website for a solution to your problem? This is a large set of issues most encountered and asked about by our clients.
Note that both the User Documentation and FAQs are updated regularly so check back whenever you have a problem or need more information.
When asking for help, please do not send your request to a specific individual but contact us at
We are here to help you but please, provide us sufficient information to help us understand the issue you are having problems with. This needs to include:
• What version of Enviro Data are you having the problem with? This information can be found in the upper-right on the main menu of both the Editor and Viewer and may be different for each. Examples would be Ver. 8D 1.73 or Ver. 8D 2.0.
• Is the problem with the Editor or Viewer?
• What specifically are you trying to do? This might include something like: “I was trying to create a Crosstab Export and had selected a Reg. Limit Group, but no Reg. Limits showed up in the export. Or “I was trying to import new records from my lab using the DTS8 format and Excel and I got an error saying _____.”
• Are you not getting any results from your selections?
• What were you expecting the output to look like?
• Did you get an error message(s)? If so, please send a screen shot.
• Is this happening on multiple computers?
• Is this a new problem or one that has been occurring for a while?
• Is your Enviro Data database local, on a network or in SQL?
• Are you using a shared Library File for lookups? (If you do not know what this is, you probably do not have one.)
• What version of Microsoft Office are you using and is it 32-bit or 64-bit?
• Screen shots are always helpful. These may be of your Select Data or Display Options forms, any error messages you receive, a copy of any output or anything that might be relevant. You can attach them to the message in JPG or PNG format. (When pasted into a message sometimes they are too small to read.) Just make sure they are large enough to be legible.
• Let us know if your issue is urgent or routine.
If you have more than one issue/question, please separate them clearly in your message. Solving an issue efficiently depends primarily on good communication. If you have multiple issues that need to be addressed, please make each clear and separate them in your message. Using numbers or bullets would be best.
Have you already contacted Geotech about this issue? If so, please provide a Reply All copy of that response. This should be obvious but Use Reply All when replying to any support message on the same topic so there is a history of what has transpired.
If this had been working last time, please describe anything new that has been changed since it worked.
If you did not knowingly make any changes that you expected to affect the results, please say so. Do not go into great detail; just mention what has changed. If the change might be relevant to the issue, we will ask for more details.
Have you made any changes, hardware or software, including but not limited to?
• Installed Enviro Data on a new computer.
• Upgraded to a new version of Microsoft Office.
• Switched from one version of Enviro Data, including updating either the Editor or Viewer alone, include that information in your message.
• If you are on a network, or using SQL Server, have any changes been made to that setup?
• Has your system crashed recently?
• Are you using a new/different/older database?
Have you had this same problem in the past? If so, what was done to fix it then?
Describe the output you expected and the output you received. People sometimes assume that the desired outcome is obvious. It often isn't, especially to someone who is not in the same room with you. Screen shots are always helpful. It's surprising how often people report that they tried something and "it didn't work", but do not describe what happened. If you expected a specific output or result, but there was none, please state that explicitly. Screen shots are always helpful.
If we ask you any questions, please read them carefully and then respond to each of them. We often add numbered steps or questions to our responses. It is very important to follow and/or answer each question. The relevance of our questions may not be apparent to you, but remember, we know how the program is supposed to work.
If you do not respond to our specific questions, you may delay finding your solution. If we ask you to choose a single data record or group of records and answer one or more questions using it, please do exactly that.
General Comments
Support time is deducted from your prepaid support account however, if we determine if the problem is a bug in the software, it will be fixed at no charge.
In many cases we may ask you to provide us with a subset of your database, your Settings file and/or any import files you are working with. You can find out how to create a subset here. Note all Access database you send must be zipped up in order be allowed into our email system.
If necessary, we will setup an online conference using Microsoft Teams. (This may require that your IT department gives permission for you to do this.) Voice communication can either by using your computer’s microphone and speakers (or a headset) or by a phone call, whichever is most convenient. This way we can see what is happening on your system to get a better idea what the problem is and how to resolve it. If needed, we may also ask for control of your computer to diagnose or fix the issue. There is no cost for this conference. Before the conference begins we recommend that you check out ZDNet's Ten golden rules for newbies and pros, especially if you have not done this before.
With your help, will attempt to address your issue as soon as possible. However, it may be necessary to assign priorities based on our mutual schedules.
If we determine that your issue is a bug or is a new feature that requires a change to the code, this could take additional time to find a solution. New features are generally preformed under a billed project once we agree on a scope of what is needed, and authorization is obtained. If you have any questions, please feel free to contact us.
Non-Detected results are common in environmental data and Enviro Data provides a complete set of tools for handling them. Using these allow you to specify exactly how you want the results displayed with options such as < .01, .01u, ND, and so on. By using detection limits along with the other features of Enviro Data, you can even specify a numeric factor or value, such as zero or half the limit, to report for the result, for special situations like contouring, statistics, or risk analysis.
The detection limit and the type of limit is provided by the lab. For example, Detect might be 0.01 and the LimitType could be “RL” and it is not unusual for a lab to provide multiple detection limits. However, the limit’s reporting units (not duplicated in the EDD) must be the same as the analytical value’s units.
The limits and limit types for each result should be in the electronic data deliverables or EDD file during the importing of data provided by the laboratory. See screenshot below. During the import, they are stored in the Detect and LimitType fields in the Analyses table. Detect is the value of the detection limit and the limit type is the type (usually an abbreviation) of the limit for that specific limit. For example. Detect might be 0.01 and the LimitType could be “RL”. The limit’s reporting units (not duplicated in the EDD) must be the same as the analytical value’s units. You can store up to five detection limits for each result in these paired fields: Detect / LimitType, Detect2 / LimitType2, etc. to Detect5 / LimitType5. The screen shot below is from the DTSFormat8.xlsx import electronic data deliverables (EDD) file showing the fields that the limits are imported from. While there are only three limits available in the DTSFormat8 EDD, you can import up to five (total) with the User-Defined Import.
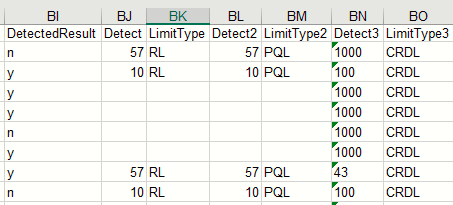
Users have the ability to choose which of the five available columns to use to store their various detection limits. Typically, the “Detect” and “LimitType” columns are used for the RL or PQL limits, and the “Detect2” and “LimitType2” columns are used for the MDLs. There’s no set rule, but obviously if you only have one limit you need to use Detect / LimitType. Also, it’s imperative to be consistent. If the detection limit columns in your databases contain a mixture of different detection limit types, Geotech can help you run a few queries to get each limit type consistently assigned to the desired column.
You can select which value you wish to display in the Non-detect Options section of the Display/Graphing Options form as shown below.

You can also select multiple detection limits in the Crosstab Wizard Export.
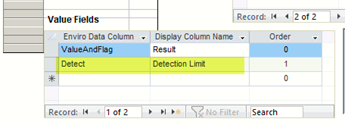
Most users, however, will choose to display (whichever limit they need) for non-detected results in the Value and Flag field selected in conjunction with the Analytical Flag codes.